
From bullet points to data visualizations: 5 data design makeover ideas
This is the blog post version of my 15-minute YouTube video.
This is also an UPDATED version compared to the YouTube video.
Still, I strongly recommend you watch the video instead of just reading the blog, because this is about how to present data using slides, not create dataviz for reports/blog posts. So, this whole thing makes a lot more sense if you see it in the same way that you’d create/see it in a real presentation.
This blog is here as a reference for those who watched the video and just want to quickly see the makeovers again.
Before we get started, you should know I have a free training!

We have all seen this type of slide, haven’t we? We have all presented this type of slide before, too. But this is #DeathByPowerpoint and we really need to stop shoving slides like in people’s faces.
We really, really need to stop presenting like this in our classes, lectures, conference presentations, workshops, job talks, and other types of presentations.

People don’t learn from slides like that, and they certainly won’t care about the material. If you have dreams of making real change as a result of your work — whether its getting scientists to adopt a new methodology or way of thinking, or getting the public to take action based on your work — then you absolutely cannot use slides like this.
That’s why I’m going to show you a better way in this post. I'm going to show you five ways to visualize those bullet points and turn them into something truly engaging and powerful.
[1] Visual + Big Text
So I'm going to show you a makeover for every single one of these boring bullet points starting with the first one.

It says “carbon dioxide has increased 40% since the pre-industrial period.”
Okay. Did you feel anything when I read that? (Again…this makes more sense if you just watch the video) Did that make an impact with you or did it just feel like a boring sentence in a list of other boring sentences? If I were in the audience, I would say that felt like a boring sentence.
So what if instead this little factoid was shared on a slide like this (see above image…or watch the video)? What do you think now if I said there's a 40% increase in carbon dioxide since the pre-industrial period.
With this design and this image, this feels serious, doesn't it? We have a powerful image, which by the way, didn't cost me anything. It was legally obtained and free. And that text is easy to read. This is obviously more memorable than a bullet point. I mean, look at this before and after.
And by the way, this took me like a minute. It is not complicated. People are always telling me that it takes “too long” to create engaging slides, but it's not true. It's only true if you don't really know what you're doing and you don't have a strategy. It takes a long time if you haven't had training on how to think of slides like this and create them in a really fast way.
[2] Icon Array
Moving on, we're back to this version which buries the stat in an un-engaging, boring wall of text.

So this bullet says “Forest degradation contributes up to 20% of global carbon emissions.”
Once again, okay, fine. Great. Just another number thrown on the slide.
We need to make this stand out a little more. How about an icon array?
Now when I say forest degradation contributes up to 20% of global carbon emissions, it feels like it matters, doesn't it? This is no longer a throwaway statistic. There are 100 of those little tree icons and 20% are colored in to visually demonstrate the percentage that I'm talking about.
I went with green because we naturally associate that color with forests. It's so easy—you can absolutely do this, too!
I did this entirely in PowerPoint, no Excel or Tableau needed. This entire slide took me about five minutes because I did have to create the icon array from scratch, but still, it's not like it took me forever. And that time spent was totally worth it, don't you think? I mean, compare the before and after here.
Creating an icon array is actually really easy. If you've watched this video about my favorite PowerPoint features, then you've already learned about icons and the arrange tool in PowerPoint, which is pretty much what you need to create an icon array. That's it. Again, everything was done in PowerPoint, so watch that video if you haven't yet, but we have more makeovers to do before you hop over to that video.
(and psst…I made an icon array template for you to use…details coming soon!)
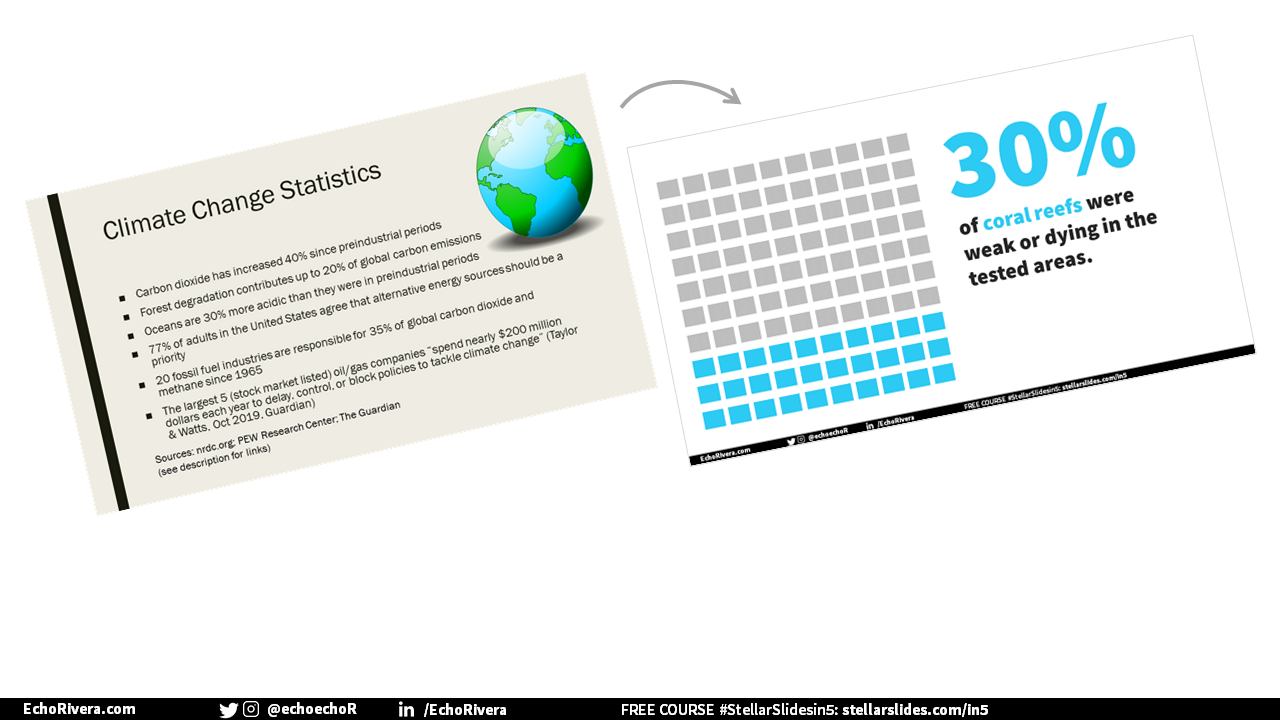
[3] Big Number (+Waffle Charts)
We're back to this slide, which feels like torture now. Now we need to talk about how “oceans are 30% more acidic than they were in pre-industrial periods.”

A bleak bullet point that is not going to be memorable in any way. I’ve done the Big Number again.
Same pattern here, and now when I say oceans are 30% more acidic than they were in pre-industrial periods, you can see how this is going to make much more of an impact compared to the original. And this slide only took a couple minutes. It took less time than the icon array because I already have a waffle chart that I've made, and I just copy and paste it over and over again. I can reuse it after I've made it. That's why I love waffle charts so much!
note: the original version showed a waffle chart for this — whoops! Waffle charts aren’t actually great for showing percentage increases and are more appropriate for stats like this (just a simple part-to-whole):
NOT A REAL STATISTIC — JUST TRYING TO SHOW HOW TO USE A WAFFLE CHART!
[4] Donut Chart
Are you hating the original slide as much as I am right now? I dread seeing it (and I'm the one who made it).
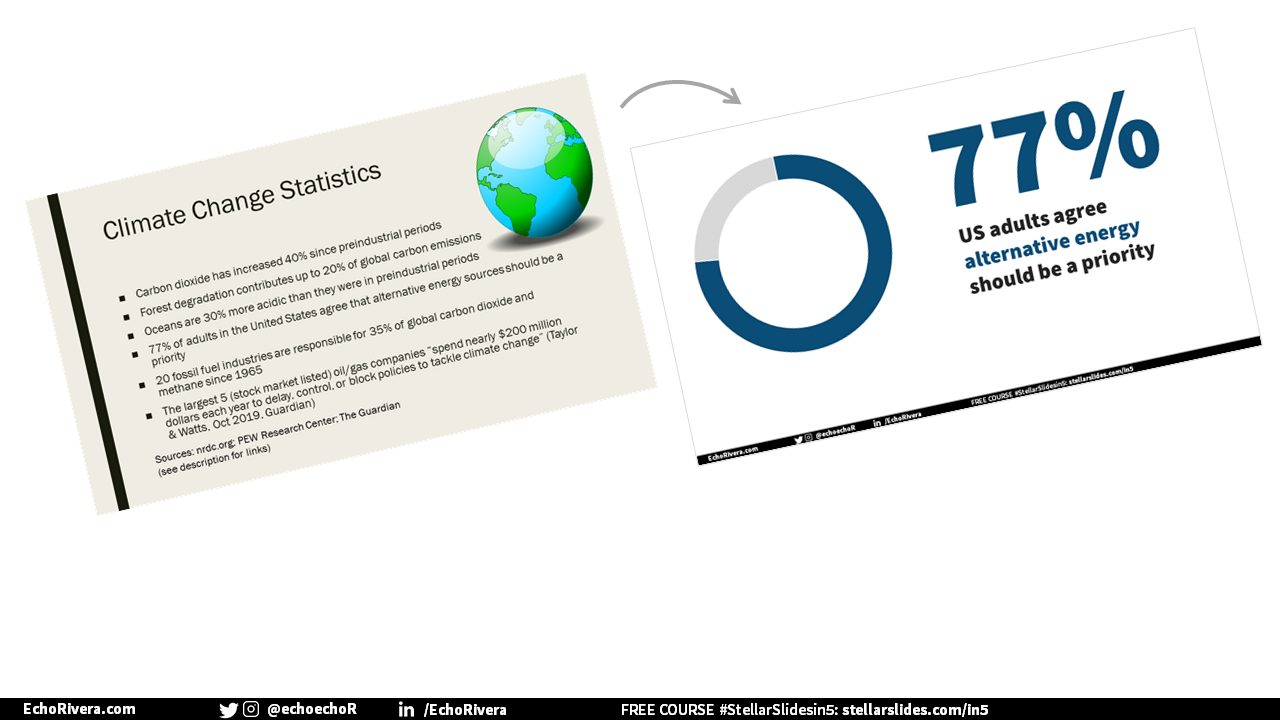
So here we've got: 77% of adults in the United States agree that alternative energy sources should be a priority.
I feel like that's supposed to be a pretty big deal, but it doesn’t feel that way, right? Not when it's just buried here. So here's how I remade this one.
For this slide I used what is called a donut chart, which is basically a pie chart that looks fancy.
So now when I say 70% of adults in the United States agree that alternative energy should be a priority, doesn't it seem like it's something worth paying attention to?
And just in case it isn't clear by now, I could have also done any of the other options I’ve shown already. Just imagine an icon array with little solar panels or windmills. That would be so neat!
I hope you're seeing that you have options here. You can mix things up. You can make it more interesting, easier to remember, and more memorable.
The whole point is just don't have a list of bullet points.
You probably don't feel excited about your data if it's presented in bullet points. Right? So let's make it more exciting for both you and your audience.
Hopefully, you’re enjoying this blog post so far, if so, you’ll love my FREE training.
[5] Multiple Design/Dataviz strategies + Animations (v1)
Okay, two more to go. You may be wondering what other tricks does Echo have up her sleeve? I'm so glad you asked because I will show you.
I used animations in the makeover, so this is another reminder that video provides additional, visual information than this blog post.

So the original slide states that 20 fossil fuel industries are responsible for 35% of global carbon dioxide and methane emissions since 1965.
Okay. Whatever, right? It's just another stat in a long list of stats.
Side note, I do have links to where I got these stats from (see below). I did do research for this post, but I am not a climate scientist. My PhD is in psychology, so I do apologize if these are outdated stats, don't quote me on these. My purpose is to show you dataviz makeovers, but I do have the links if you want to check them out.
Moving on, I went all out for this one by adding animations. For this slide I would say only 20 fossil fuel companies are responsible for 35% of global carbon dioxide and methane since 1965.
Do you see how much more important that is with this slide? Not to mention, visually there's just more to help you understand that information. This obviously involves some animation and timing, so it took a little longer than others, but still only took like five minutes. These are not taking forever to make. And those animations are something I would have practiced already to make sure I have the timing down.
[5] Multiple Design/Dataviz strategies + Animations (v2)

Okay, last example. This one isn't a percentage, it's just numbers. Let me show you how to work with that. It's actually going to be almost identical to the last one. I would say, “five oil and gas companies spend nearly $200 million every single year on lobbying to delay control or block policies that combat climate change.”
So I just wanted to show you it doesn't need to be a percentage for you to add this kind of design to your bullet points. I already used this setup/layout, so I saved time by duplicating the first slide and editing a few things. This did not take a lot of time because I was smart and I used that copy and paste strategy.
What do you think of these before/after makeovers?

Here is the before and after. Hopefully this post is proof that you should not have slides that look like the original version, whether it's in your introduction or your results.
[BONUS] Use your beautiful new dataviz slides in creative ways
Before I talk about the templates you can download, I also want to mention something a lot of people don't think about.
Did you know you can export your slides as images? Yup! You can.
A lot of people don’t think about this because they know that their wall-of-text slides wouldn’t actually make great images. But once you start to design better slides, then it will make sense to export them as images and use them in other ways.
For example, you can share them on social media and post them on your website.
These types of slides (the “afters” in this post) are shareable graphics now. These will be MUCH more likely catch people's attention than that wall of text, which you can use to:
Invite people to your upcoming conference presentation or webinar
Encourage people to visit your website
Spread the news about your manuscript that finally got published
Imagine exporting the original wall of text as an image and sharing that on social media. If you said “Hey, come to my webinar because this is the type of slides you will see.” Are people going to be excited? No. They're going to be like, “HARD PASS”
But if you share slides like the afters and say, “Hey, come to my webinar,” Well, now you've got people's attention, now they're interested and engaged before they even watch your webinar.
Hopefully that further convinces you to spend more time creating data visualizations for your slides. It doesn't take a million hours to do, and you can start using your slides for additional purposes. What do you think? Would you rather see the original or the new versions?

I really want to emphasize that this was all easy peasy, lemon squeezy strategies. They took me just a few minutes each to create and, again, I used copy and paste whenever I could. It's all worth the effort because then I can even start using them for other things too, like social media and my website.
The “elephant in the room” however, is that I’ve spent a lot of time practicing this and I know exactly what to do for my data visualizations. It won’t be that fast unless you’ve had training on exactly WHAT to do, WHEN it makes sense to do it, and HOW to do it…which is exactly the type of thing you learn in my online courses and workshops.
If you’re still stuck on the idea that it “takes too long” to make engaging presentations—with or without data—then make sure you check out my professional development course. Because, you’re right—it takes too long when you don’t know what you’re doing or when you’re approaching it in inefficient ways. The purpose of training is to show you how to do it right the first time, without wasting any time.
As usual, thanks for reading and thank you so much for helping me end #DeathByPowerpoint. We can do this!
with joy,
Echo Rivera, PhD
References
Additional Reading